Nifty
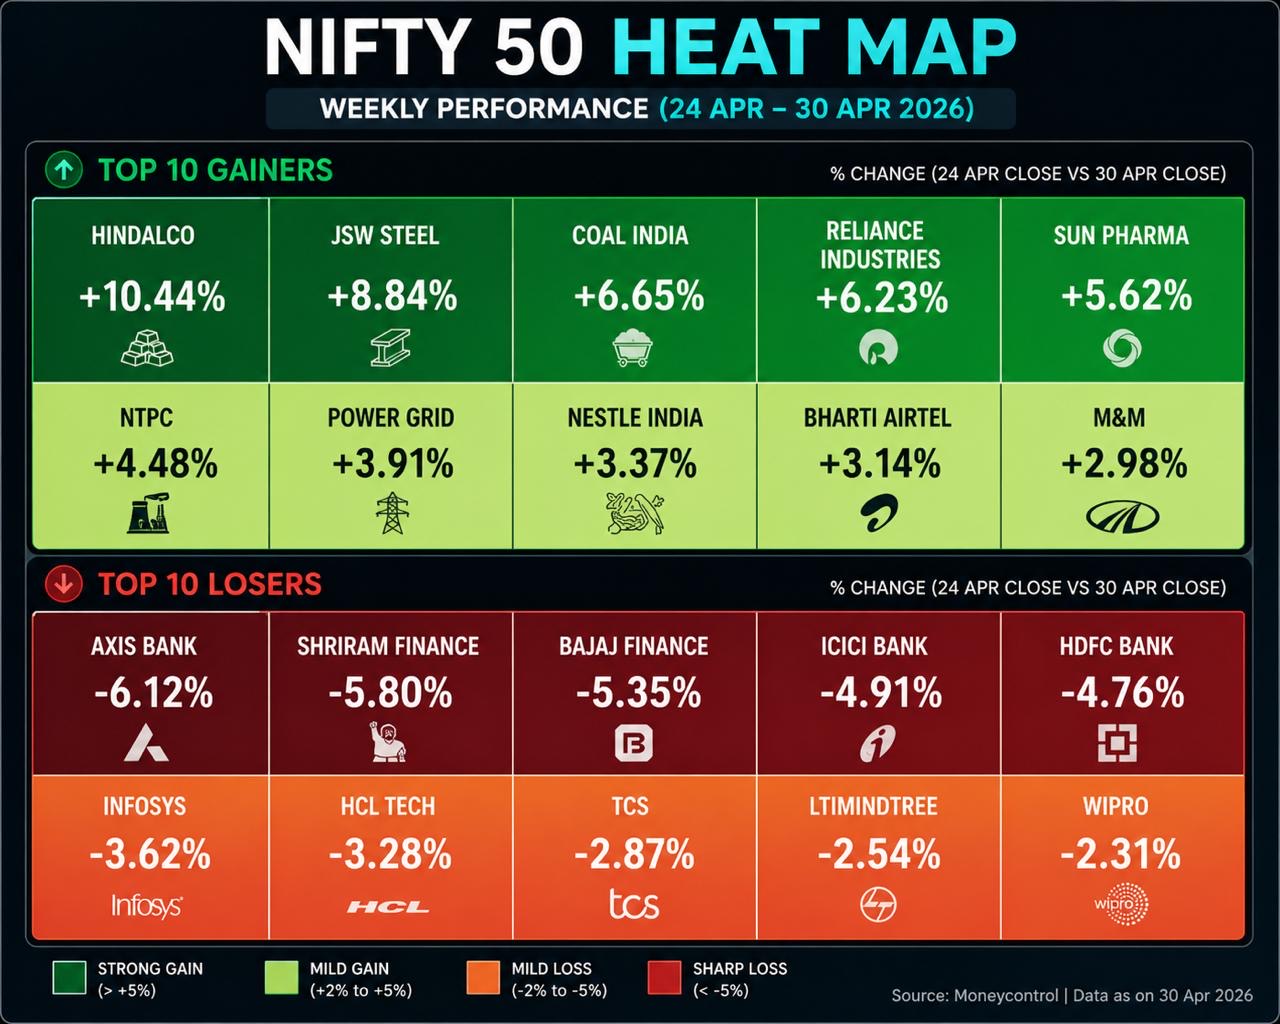
Heat map - see how the week looked
Lumic
Heat map - see how the week looked
Nifty·
Dive into the weekly financial market overview with our heat map feature. This visual analysis showcases the top gainers and losers across the Indian stock market, giving you a clear picture of the week's trading sessions. Understand how different sectors performed and identify trends that shaped the Nifty today. Lumic's 'Results' category brings you these essential insights, helping you navigate the complexities of Indian finance and equity markets. By observing this heat map, you can better grasp market sentiment and the factors influencing stock performance, all presented in an easy-to-understand format.
More in Nifty

Lumic
3 days ago
Nifty
Regional Jewellers Line Up IPOs, Eyeing Tanishq-Like Growth
- Regional jewellers across India are increasingly turning to IPOs to fund expansion
- Family-run jewellery chains are seeking public markets to build larger national brands
- Organised jewellers are expanding beyond home markets, increasing competition in retail
LUMIC INSIGHT
India’s jewellery sector is seeing a stronger shift toward organised
Economic Times·

Lumic
4 days ago
Nifty
NSE IPO Opens at ₹1,700–₹1,785: Key Details for Investors.
- NSE IPO price band is ₹1,700–₹1,785, with a minimum lot size of 8 shares for investors
- The ₹22,568.94 crore issue is an OFS of 12.64 crore shares by existing NSE shareholders
- NSE raised ₹6,746.18 crore from anchor investors ahead of the public issue opening today
LUMIC INSIGHT
GMP indicates moderate gains on listing
NDTV Profit·