BFSI
SBI Stock vs FD Returns: What ₹1 Crore Invested Over 10 Years Reveals
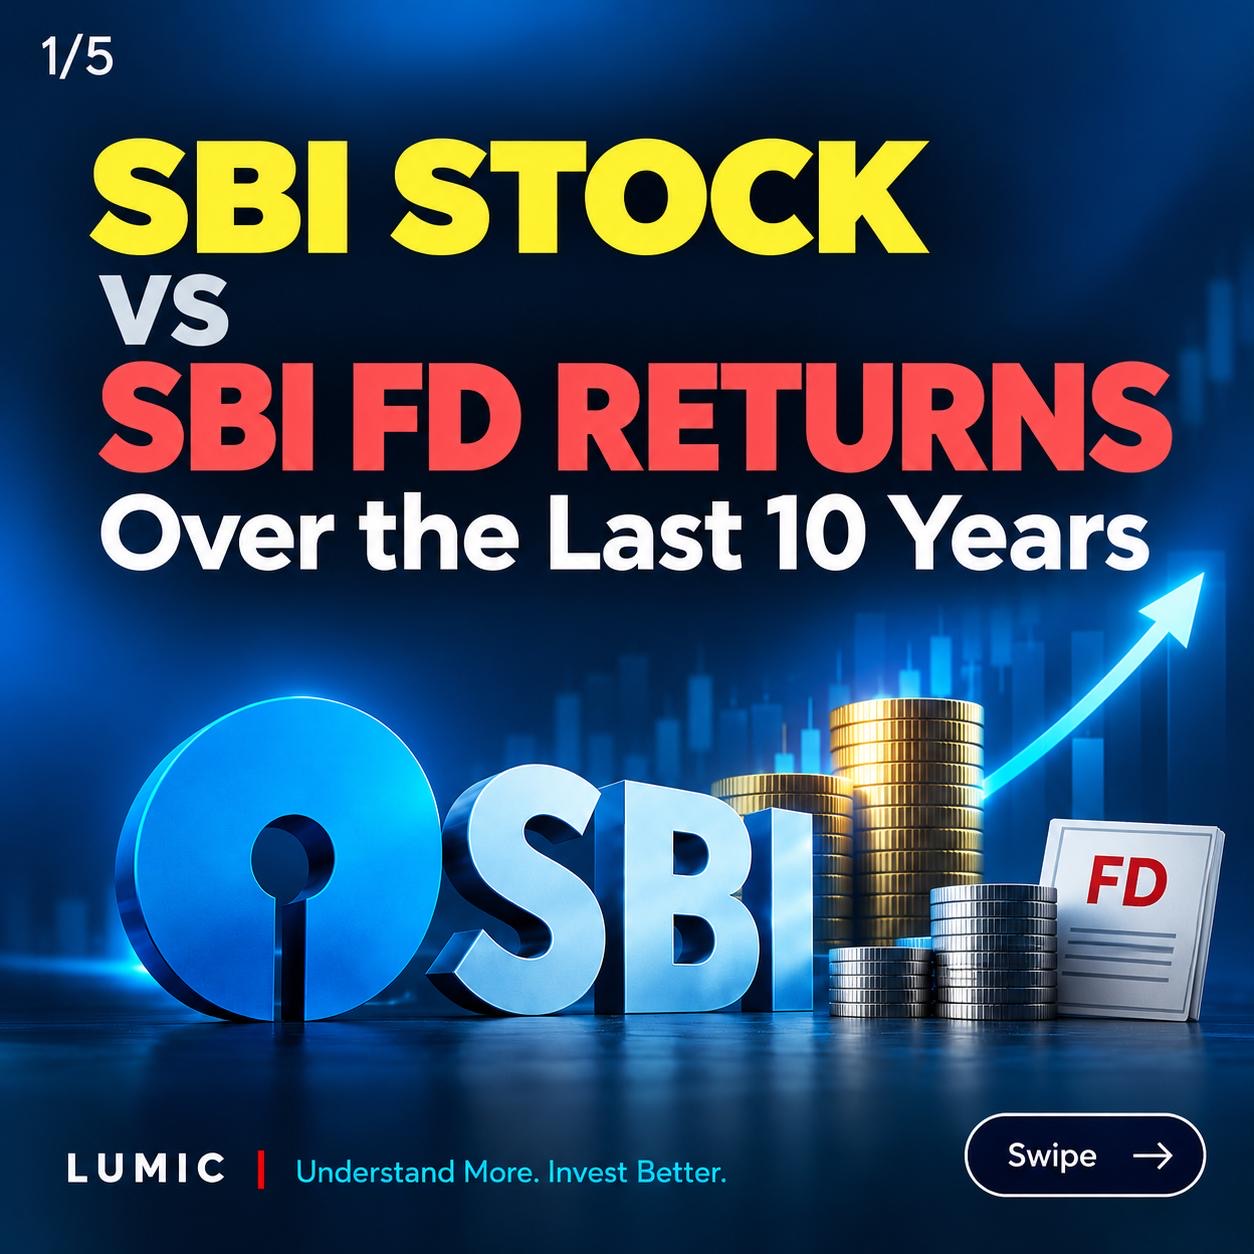
This Lumic insight carousel delves into a comparative analysis of State Bank of India (SBI) stock performance versus Fixed Deposit (FD) returns over a decade. We examine what an investment of ₹1 crore would yield in both scenarios, offering a clear picture of long-term investment returns in the Indian banking sector. The analysis considers SBI's share price performance, its Compound Annual Growth Rate (CAGR), and overall financial performance, including net profit growth and the impact of provisions. Understanding stock market vs fixed deposit returns is crucial for investors navigating the Indian finance landscape. This piece aims to provide Lumic’s financial insights without hype, focusing on factual data for informed decision-making.
This Lumic insight carousel delves into a comparative analysis of State Bank of India (SBI) stock performance versus Fixed Deposit (FD) returns over a decade. We examine what an investment of ₹1 crore would yield in both scenarios, offering a clear picture of long-term investment returns in the Indian banking sector. The analysis considers SBI's share price performance, its Compound Annual Growth Rate (CAGR), and overall financial performance, including net profit growth and the impact of provisions. Understanding stock market vs fixed deposit returns is crucial for investors navigating the Indian finance landscape. This piece aims to provide Lumic’s financial insights without hype, focusing on factual data for informed decision-making.
More in BFSI

BFSI
Why Is Bandhan Bank’s Share Price Jumping Nearly 8% Today?
- Potential investor interest: Abu Dhabi’s IHC is exploring a stake in Bandhan Financial Services
- Possible stake sale: The proposed transaction could offer an exit route to existing investors
- Deal remains uncertain: Discussions at early stage, with no confirmed final transaction announced
BFSI