Investing
ARPU: The Number That Could Decide Telecom Valuations
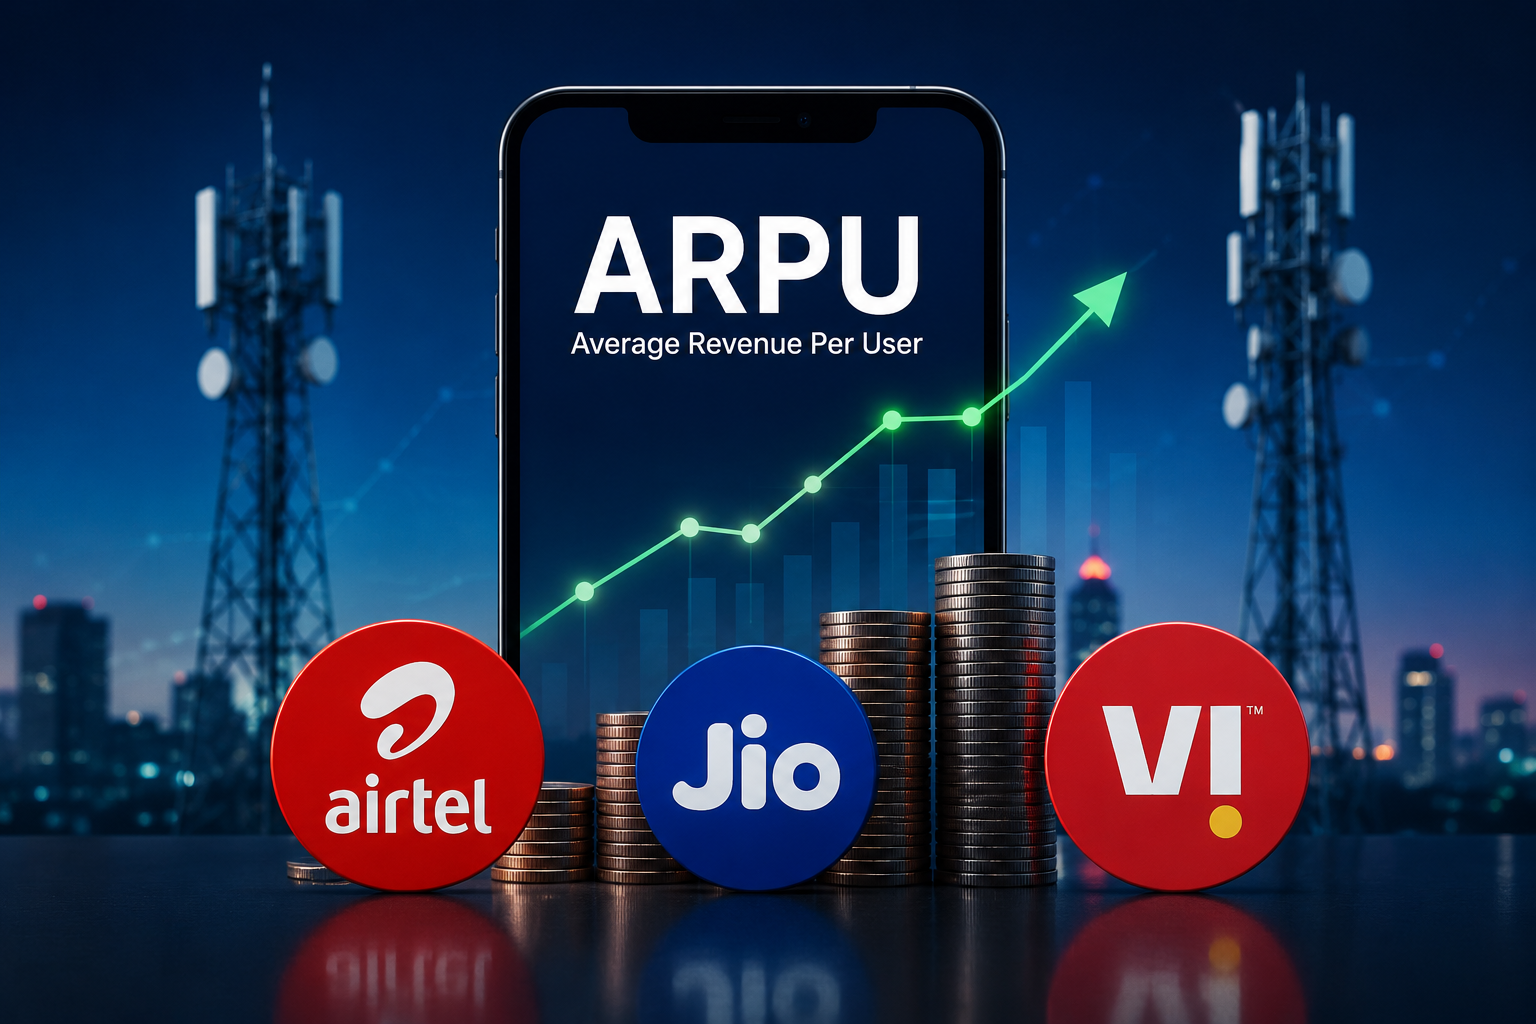
Telecom companies often highlight subscriber numbers, data usage and network expansion. But for investors, one metric increasingly deserves closer attention: ARPU, or Average Revenue Per User.
ARPU measures how much revenue a telecom operator generates from each subscriber on average. More importantly, it provides a link between subscriber monetisation, revenue growth, EBITDA, cash generation and ultimately valuation.
When subscriber growth starts to mature, the question changes from “How many users can the company add?” to “How much can it earn from each user?”
From Price Wars to Monetisation
When Reliance Jio entered India's telecom market in 2016, cheap data, free voice and aggressive customer acquisition transformed the industry.
As the market consolidated, the focus gradually shifted. Subscriber growth became less important than the ability to monetise the existing customer base.
This is where ARPU becomes important.
A higher ARPU means an operator can generate more revenue from the same subscriber base. If operating costs do not increase proportionately, a meaningful portion of that additional revenue can flow through to EBITDA and cash generation.
How Airtel, Jio and Vi Have Improved ARPU
The ARPU journey of India's major telecom operators shows how monetisation has changed over time.
| Exit Quarter | Airtel | Jio | Vodafone Idea |
|---|---|---|---|
| FY21 | ₹145 | ₹138 | ₹107 |
| FY22 | ₹178 | ₹168 | ₹124 |
| FY23 | ₹193 | ₹179 | ₹135 |
| FY24 | ₹209 | ₹182 | ₹146 |
| FY25 | ₹245 | ₹206 | ₹173 |
Figures are rounded from company/industry disclosures.
The increase has been supported by factors such as tariff increases, premiumisation, migration to 4G/5G and changes in subscriber mix.
But the more important investment question is no longer simply who has the highest ARPU.
It is:
How much is the market willing to pay for the next ₹50 of ARPU?
Q1 FY27: Airtel Still Leads
The latest quarter keeps the same hierarchy intact.
| Operator | Q1 FY27 ARPU | Gap vs Airtel |
|---|---|---|
| Bharti Airtel | ₹264 | — |
| Reliance Jio | ₹215.6 | -18.3% |
| Vodafone Idea | ₹195 | -26.1% |
Airtel continues to command a significant monetisation premium.
However, the same ARPU number has a different economic meaning for each operator because subscriber scale, margins, balance sheets and valuation expectations are different.
Airtel: The Premium Monetiser
Airtel's ARPU leadership is one of its key competitive advantages.
Its higher ARPU reflects factors including premiumisation, a stronger subscriber mix, postpaid additions and network-led customer quality.
At Airtel's scale, even a small increase in ARPU can create substantial incremental revenue.
For example, across a hypothetical base of 500 million subscribers, a ₹10 monthly increase in ARPU would translate into ₹6,000 crore of additional annual revenue, before considering churn, taxes and incremental costs.
This is why ARPU growth can become high-quality growth when the underlying network and cost base are already established.
Jio: Lower ARPU, Larger Monetisation Runway?
Jio's ARPU remains below Airtel's, but the investment case extends beyond today's telecom revenue.
The market is also valuing Jio's scale, 5G opportunity, broadband, enterprise business, digital platforms and future monetisation potential.
In other words, investors may be willing to pay for the monetisation runway before it fully appears in reported ARPU.
The key risk is execution.
That premium valuation ultimately needs the expected monetisation opportunity to translate into higher earnings and cash flow.
Vodafone Idea: When ARPU Becomes a Survival Variable
For Vodafone Idea, rising ARPU has a different significance.
Its ARPU has improved materially, reaching ₹195 in Q1 FY27. But for Vi, higher ARPU is not simply about improving shareholder returns.
It is also critical for generating the cash needed to fund network investments and manage financial obligations.
This creates a difficult cycle:
Higher ARPU → More cash generation → More network investment → Better customer retention → Sustainable ARPU growth
But if network investment remains constrained, protecting the subscriber base and sustaining future ARPU growth becomes more challenging.
That creates potentially significant operating leverage, but also substantial balance-sheet risk.
The Valuation Bridge: ARPU → EBITDA → Valuation
The real power of ARPU becomes clearer when it is connected to valuation.
Consider a simplified telecom operator with 500 million subscribers.
A ₹10 increase in monthly ARPU would generate:
- ₹6,000 crore of additional annual revenue
- If 50% converts into EBITDA, ₹3,000 crore of additional EBITDA
- At a 10× EV/EBITDA multiple, this could imply ₹30,000 crore of incremental enterprise value
- At a 15× multiple, the same EBITDA increase could imply ₹45,000 crore of incremental enterprise value
The important point is that the same ARPU increase can produce very different valuation outcomes.
The market is effectively answering two questions:
- How high can ARPU go?
- What valuation multiple should the resulting earnings receive?
What Does a ₹300 ARPU Mean?
A ₹300 ARPU provides an interesting way to compare the three operators.
At current levels:
- Airtel at ₹264 needs roughly 14% growth to reach ₹300.
- Jio at ₹215.6 needs almost 39% growth.
- Vi at ₹195 needs more than 50% growth.
The target is the same, but the investment implications are very different.
For Airtel, ₹300 represents a monetisation journey that is already underway.
For Jio, it represents a much larger step-up in monetisation.
For Vi, reaching ₹300 could be transformative, but would need to happen alongside balance-sheet repair and continued network investment.
The Next Tariff Hike Could Change the Equation
The telecom sector is widely expected to see another tariff increase.
But investors should not simply apply the headline tariff increase to current ARPU.
The more important questions are:
- How much of the increase will actually stick?
- How much customer churn will it create?
- Will premiumisation continue?
- How much incremental EBITDA will be generated?
- How much of that EBITDA will ultimately become free cash flow?
- And most importantly, how much of the expected tariff increase is already reflected in stock prices?
These factors will determine whether higher tariffs genuinely create shareholder value.
ARPU Is Really About Pricing Power
ARPU is not valuable simply because ₹264 is higher than ₹215.6.
It matters because ARPU can reveal the underlying pricing power of a telecom operator.
An operator with strong network quality, low churn, high-value customers, rising data consumption and a powerful brand may be able to increase ARPU without proportionately damaging its subscriber base.
That is the real economic advantage.
The Lumic Take
ARPU is often treated as just another KPI in a telecom company's quarterly results presentation.
For investors, it deserves much more attention.
The real question is not simply:
“Who has the highest ARPU?”
It is:
“Who has the greatest ability to increase ARPU—and how much of that upside is already reflected in the valuation?”
Today, Airtel has the strongest monetisation profile.
Jio has enormous scale and arguably one of the largest monetisation runways.
Vodafone Idea has potentially significant operating leverage, but also the greatest balance-sheet risk.
The telecom battle may no longer be primarily about acquiring the most subscribers.
It may increasingly be about extracting the most value from each subscriber.
And in that battle, ARPU could be the number that ultimately decides the multiple.
Note: ARPU, EBITDA and valuation multiples should not be compared mechanically across operators. Spectrum costs, capex, lease accounting, subscriber mix, net debt and non-telecom businesses can materially affect the appropriate valuation multiple.