Markets
HDFC Bank Share Price: 52-Week High/Low & Why It’s Falling

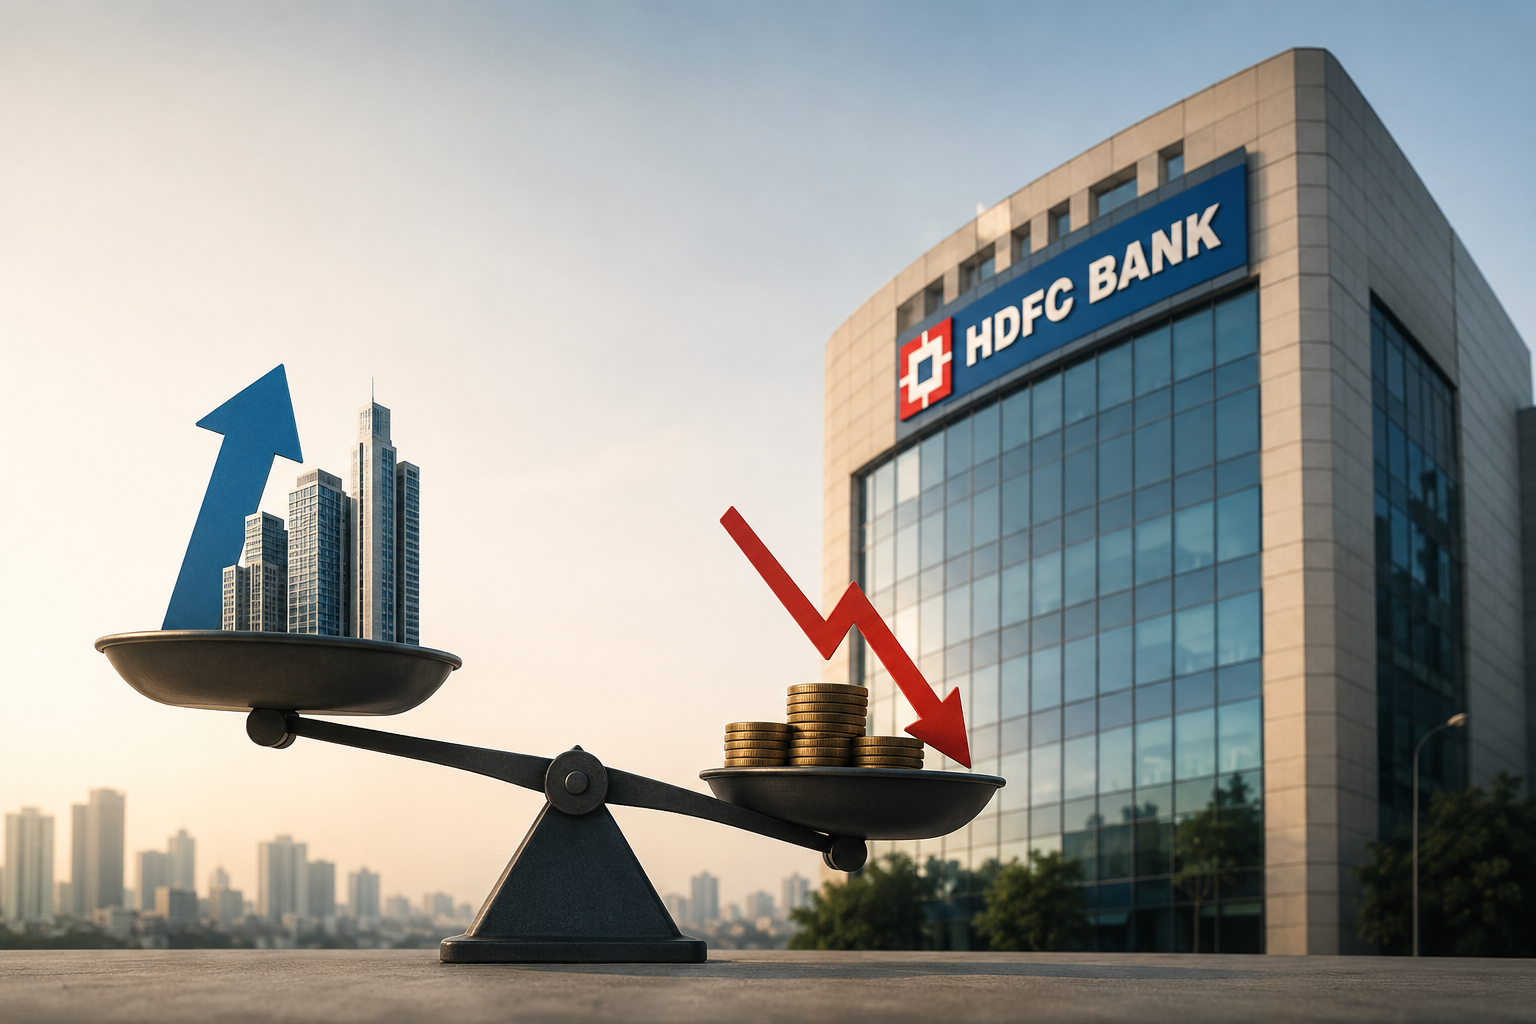
If you've pulled up the HDFC Bank stock price chart recently, the picture looks rough: a stock trading well below its 52-week high, a steep year-to-date decline, and headlines about record-low bond prices.
Now pull up the bank's actual balance sheet, and you'll find healthy deposit growth, strong asset quality, and capital levels well above what regulators require.
That gap between the stock price and the balance sheet is exactly the disconnect this article digs into.
Key Takeaways
- HDFC Bank's stock has fallen sharply in 2026, trading well below its 52-week high and near its 52-week low, largely due to CEO succession uncertainty and prior governance concerns.
- The bank's core balance sheet remains healthy, with strong deposit and loan growth, low and stable non-performing assets, and capital adequacy well above regulatory requirements.
- Net interest margin is the genuine soft spot, having compressed to its lowest recorded level — separate from the governance overhang.
- Analyst opinions are mixed but not broadly bearish on fundamentals; most of the caution is centred on leadership transition risk rather than deteriorating financials.
- A falling price next to a healthy balance sheet reflects priced-in uncertainty, not necessarily a change in business quality — and the two can stay disconnected until specific catalysts, like CEO clarity, play out.
HDFC Bank Share Price: Quick Snapshot
| Metric | Value |
|---|---|
| Share price | Around ₹700–703 |
| 52-week high | ₹1,020.50 |
| 52-week low | Around ₹698.50–726.65 (varies slightly by data source) |
| Market capitalisation | Roughly ₹10.97 lakh crore |
| P/E ratio | Around 14.5 |
| 1-year return | Approximately -24% to -28% |
The stock has been trading close to its 52-week low for weeks — a sharp contrast to where it stood earlier in the year — and it has meaningfully underperformed the broader Nifty 50 through 2026.
What's Actually Driving the Stock Down?
The most immediate trigger is leadership uncertainty. In late August 2026, HDFC Bank's MD and CEO informed the board that he would not seek another term, with his tenure set to end in late October 2026.
The decision came as a surprise to many market watchers, since the CEO had earlier signalled willingness to continue.
This leadership transition hasn't happened in isolation. It follows a string of governance-related concerns at the bank over the past couple of years — including scrutiny over specific deposit and bond-sale practices, and the earlier abrupt resignation of the bank's chairman citing differences over values and ethics.
An external review reportedly did not substantiate the concerns raised, but the cumulative effect has clearly weighed on investor sentiment. The bank's dollar bonds have also fallen to record lows in the days following the CEO announcement.
On top of the leadership overhang, the bank's net interest margin (NIM) — a core measure of how profitably a bank lends relative to its cost of funds — has been under sustained pressure, touching its lowest recorded level in the most recent quarter.
That combination of a governance overhang and margin compression is a big part of why the stock has been marked down, even as other parts of the business look solid.
How Healthy Is the HDFC Balance Sheet?
This is where the "disconnect" becomes clearer. Based on the bank's most recent quarterly results (Q1 FY27, for the quarter ended June 2026):
| Balance Sheet Metric | Q1 FY27 Value |
|---|---|
| Net profit (PAT) | ₹19,060 crore, up about 5% YoY |
| Net interest income (NII) | ₹33,530 crore, up about 6.7% YoY |
| Deposit growth | Around 14.7% YoY |
| Advances (loan book) growth | Around 15.5% YoY |
| Gross NPA (asset quality) | Around 1.17% (ex-agri: 0.91%) |
| Net NPA | Around 0.41% |
| Capital Adequacy Ratio (CAR) | Around 19.6%, well above the regulatory minimum |
| Net interest margin (NIM) | Around 3.26%, its lowest recorded level |
Overall, these metrics point to a bank that remains fundamentally strong. The deposits and loans are growing at healthy double-digit rates, asset quality remains stable, and capital levels provide a comfortable cushion above regulatory requirements.
The weak spot is margin compression. HDFC Bank's NIM has declined for several quarters, putting pressure on the profitability of its core lending business. So while the book continues to grow, the bank is earning less from each rupee of assets — an issue investors should watch closely in the coming quarters.
Why Analysts Are Divided on HDFC Bank Stock?
Brokerage views on the stock have been mixed but not uniformly bearish, which is itself part of the disconnect story.
Some brokerages have maintained a positive rating on the stock, arguing that the current price already reflects most of the near-term uncertainty and that valuations look inexpensive relative to the bank's franchise strength.
Others have trimmed price targets, specifically citing the leadership transition and reduced clarity on strategic direction, while still describing the bank's core fundamentals — deposit growth, loan growth, profitability — as constructive.
At least one major brokerage downgraded its rating, pointing to margin pressure as the key concern rather than the leadership change itself.
The common thread across most brokerage commentary: the fundamentals aren't the primary worry; the uncertainty around succession, governance, and near-term margin recovery is.
What This Disconnect Actually Means for Investors
A falling stock price next to a healthy balance sheet isn't unusual. Markets often price in uncertainty and sentiment well before — or instead of — fundamentals actually deteriorating. A few things worth understanding rather than assuming:
- A stock price reflects expectations, not just current financials. Leadership uncertainty and governance concerns can weigh on a stock even when reported numbers look fine, because investors are pricing in the risk of what might change.
- A "cheap" valuation isn't automatically a buying signal. A lower price-to-book or P/E ratio only means the stock is statistically cheaper than before, not that the uncertainty driving the price down has resolved.
- Margin pressure is a genuine, separate issue from governance. Even if leadership uncertainty resolves smoothly, the bank still needs to show its net interest margin stabilising for profitability to catch up with balance sheet growth.
- Recovery, if it comes, is likely tied to specific catalysts — such as clarity on the next CEO, signs of margin stabilisation, and continued asset quality strength — rather than time passing on its own.
- None of this is a signal to buy or avoid the stock. It's simply a framework for understanding why the share price and the balance sheet are telling two different stories right now, and what would need to change for that gap to close.
Things to Watch Going Forward
- Announcement and market reaction to the next MD and CEO.
- Whether net interest margin shows signs of bottoming out in coming quarters.
- Continued trends in deposit growth, loan growth, and asset quality.
- Any further governance-related developments or regulatory commentary.
- Movement in the stock relative to its 52-week high and low as sentiment shifts.
Conclusion
HDFC Bank's current stock story is a reminder that share price and business fundamentals don't always move together in the short term.
The bank's balance sheet — deposits, loans, asset quality, and capital — looks solid by most conventional measures, while the stock itself has been weighed down by leadership uncertainty, governance overhang, and margin pressure.
Understanding which part of that story is temporary sentiment and which part is a genuine business issue is more useful than reacting to the price move alone.
Disclaimer: This article is for educational purposes only and does not constitute investment advice. Equity investments are subject to market risks. Please consult a SEBI registered investment adviser before making investment decisions.