Markets
The Oil Shock Happened Six Months Ago. Why Are Markets Reacting Now?

The answer is surprisingly simple: oil prices move first. Their damage to corporate earnings comes later.
The Big Idea
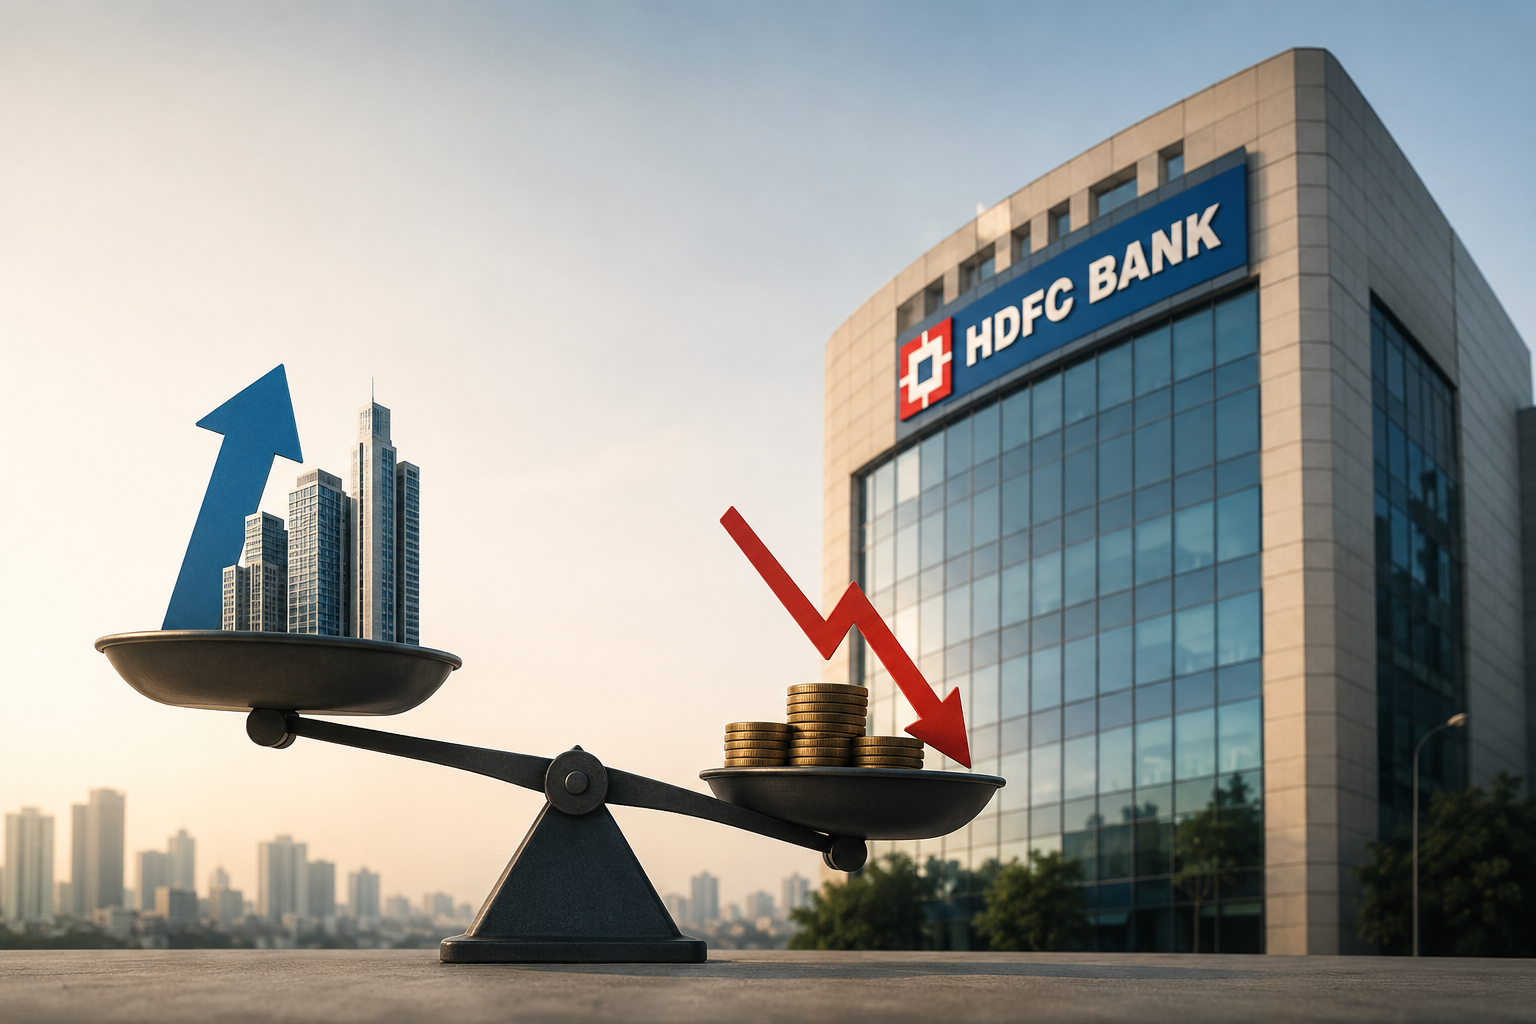
Brent crude is back around $105–107 a barrel. But oil has been expensive since March. The sharper market reaction now is about something more important: the shock has had time to travel through costs, margins, pricing, demand and earnings expectations.
Think of an oil shock as a ripple, not a bang.
| Timeline | What is happening |
|---|---|
| Oil price rises | Month 1 |
| Fuel, freight and energy costs start rising | Months 1–2 |
| Companies absorb some higher input costs | Months 2–4 |
| Margins begin to get squeezed | Months 3–6 |
| Companies try to pass costs to customers | Months 4–6+ |
| Demand and earnings expectations can weaken | Later |
1. The first casualties were easy to spot
Some businesses feel crude prices almost immediately. Airlines face higher jet-fuel costs, while oil marketing companies are directly exposed to the relationship between crude costs and retail fuel prices. These were among the earliest places where investors could see the oil shock. But that was only the beginning.
2. Then the shock starts travelling
Oil is not merely a fuel. It sits inside a huge number of business costs. A product may travel from factory to truck to warehouse to distributor to retailer. Every step uses energy. Higher oil can therefore gradually raise transportation, logistics, packaging, petrochemical and manufacturing costs.
3. This is where the earnings cycle becomes important
Companies do not necessarily report a huge margin hit the moment crude rises. They may absorb the increase, negotiate with suppliers, change procurement or wait for contracts to reset. Only over time does the accumulated cost become visible in reported margins. That is the transmission lag.
4. Companies cannot always pass costs on
If an input cost rises 10%, a company may not be able to raise its selling price 10%. Competitors may hold prices down and consumers may buy less. The company is then caught between higher costs and limited pricing power. The difference comes out of margins.
5. Why September matters
By September, investors had roughly six months to observe the consequences of the original oil shock. In March, the question was: "How bad will this be?" Six months later, the question becomes: "How many more companies are going to be affected?" The market is no longer pricing merely the possibility of expensive oil; it is beginning to price the second-order consequences.
6. The second-order effect is much bigger than the first
The first-order effect is easy: oil up means higher airline costs. The second-order chain is broader: oil up → fuel and freight costs up → corporate input costs up → margins down → price increases → possible demand slowdown → earnings revisions → valuation pressure.
7. Then comes the global interest-rate problem
US bond yields have also been rising. That creates a second pressure: oil raises inflation risk, while higher yields raise the cost of money. Together, they can make investors question how quickly interest rates can fall and how much they should pay for future earnings.
8. India has an additional vulnerability
India imports a large amount of crude. Expensive oil therefore affects the import bill, the rupee and domestic inflation. At the same time, high US yields and a stronger dollar can make emerging-market assets relatively less attractive to foreign investors. India can therefore face both earnings pressure and capital-flow pressure.
9. Why can the market fall faster than the economy?
Markets do not wait for final earnings numbers. They try to anticipate them. If investors believe the next two quarters will be difficult, they can reduce valuations today. Economic damage can therefore be slow while the stock-market reaction is fast.
10. High valuations can magnify the reaction
When stocks are priced for strong growth, expectations are high. A company expected to grow earnings 20% can be hit if investors suddenly expect 14%, even if the company remains profitable and continues to grow. The issue is not necessarily that the business became bad; expectations changed.
The Six-Month Transmission Map
| Stage | What happens |
|---|---|
| 1. Oil shock | Crude jumps sharply. |
| 2. Direct impact | Airlines, OMCs and fuel-sensitive businesses feel it first. |
| 3. Cost transmission | Freight, energy and input costs rise. |
| 4. Margin pressure | Companies initially absorb some of the increase. |
| 5. Pricing response | Some higher costs are passed to customers. |
| 6. Demand response | Higher prices can eventually affect consumption. |
| 7. Earnings revisions | Analysts begin cutting margin or earnings expectations. |
| 8. Valuation adjustment | Investors become willing to pay less for future earnings. |
| 9. Capital-flow pressure | High global yields and a stronger dollar can pressure emerging-market flows. |
| 10. Market reaction | An oil shock becomes a broad equity-market correction. |
The Lumic Takeaway
The most important lesson is not actually about oil. It is about how economic shocks travel.
Markets react to the shock first. Companies experience the consequences later. Earnings reveal the damage even later. Investors then reprice the future.
So when you see an oil spike, don't ask only: "What will happen to oil companies?"
Ask: "Where will this oil price eventually show up in the income statement?"
That could be in airlines → logistics → paints → chemicals → manufacturing → consumer companies → construction → margins → consumption → earnings.
And that is why the market can look strangely calm for months... and then suddenly appear to "discover" the oil problem.
It didn't discover the problem. The problem finally travelled far enough to become visible.
Source and editorial note: Core thesis based on the Economic Times Prime article, "Six months after oil spiked, why are markets reacting so sharply now?" (30 September 2026). The article's central point is that crude has been expensive since March and the current market reaction reflects the delayed manifestation of the shock. This Lumic version reframes the mechanism in simpler language and adds an explanatory transmission map.