Markets
Which Sectors Have the Edge in Q2 FY27? 5-Year Data
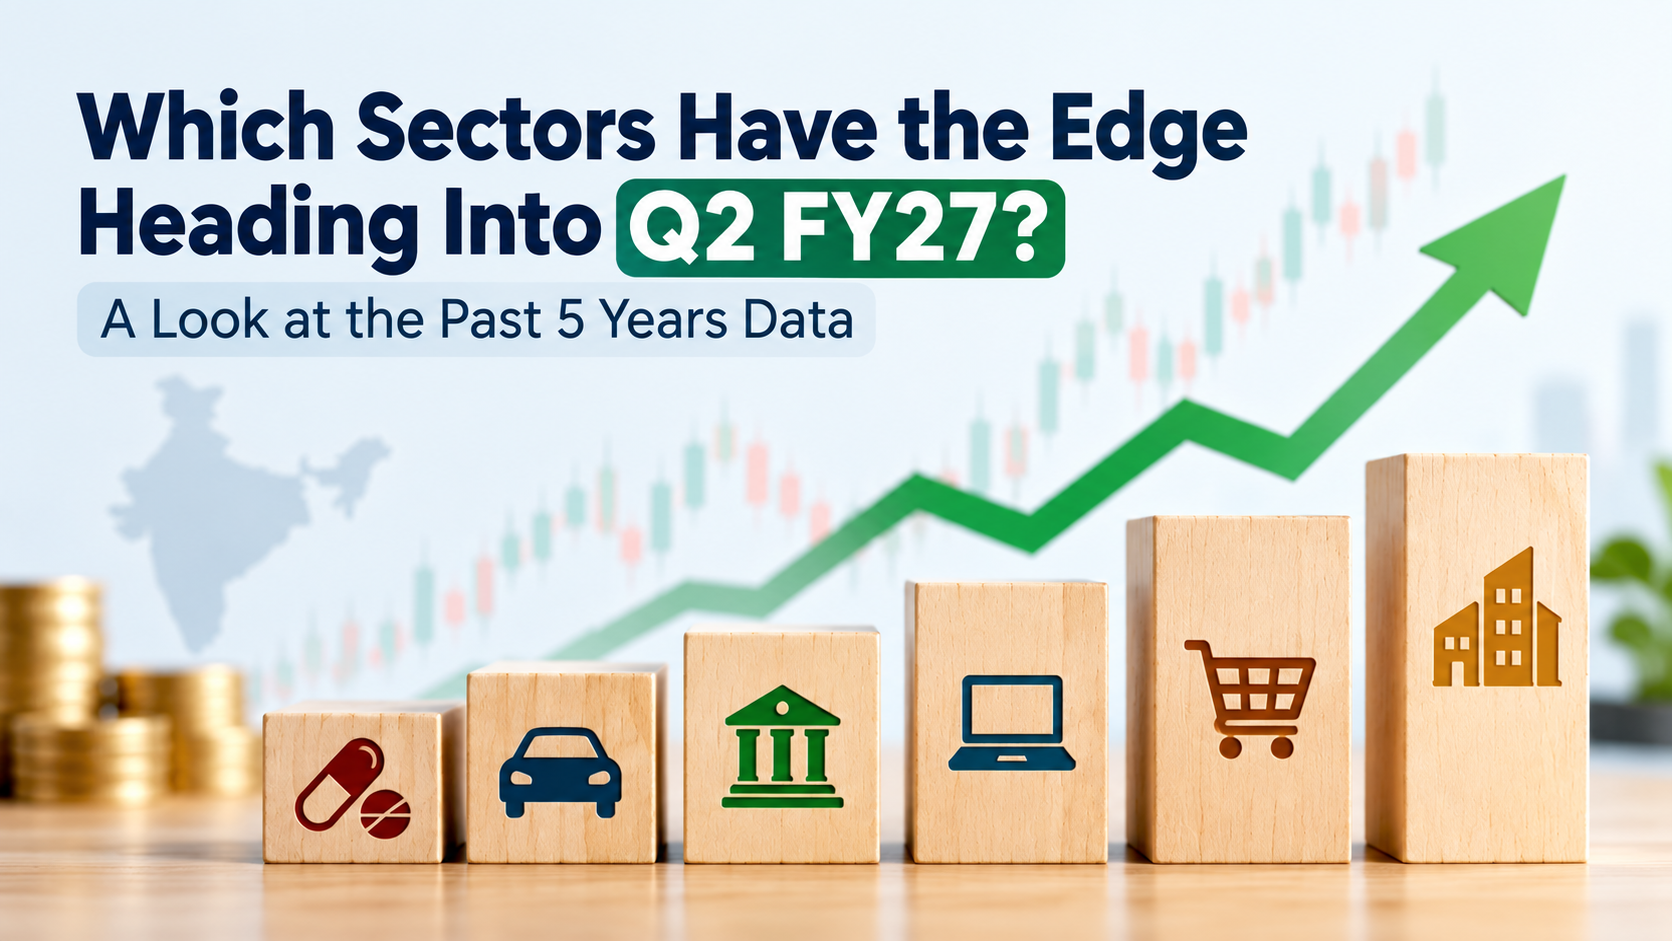
As Q2 FY27 earnings season approaches, investors should be looking beyond individual companies to understand how major sectors have performed and what could shape their next phase.
One way to compare the pharmaceutical sector, banking industry, IT industry, FMCG industry, and the automobile sector in India is through the five-year performance of their respective NSE sectoral indices. As of 30 September 2026, Nifty Pharma had delivered a five-year CAGR of 13.64%, followed by Nifty Bank at 8.72%, Nifty FMCG at 3.65%, while Nifty IT recorded a five-year CAGR of -2.63%.
These figures show how differently sectors have performed over a longer period, but the Q2 FY27 outlook requires a closer look at current earnings, valuations, and sector-specific developments.
What Does Five-Year Sector Data Tell Investors?
Five-year returns may demonstrate how a sector has performed during various market and economic environments. But they are to be regarded as a historical context and not a prediction.
Performance of sectors can be affected by growth of earnings, valuation, interest, currency exchange, commodity prices, global demand, regulation and investor expectations. According to NSE, returns over a period of more than 1 year are expressed as CAGR, and index returns on the sector are determined using total-return index values.
Thus, a 5-year performance can serve as a baseline. Investors can then analyze ongoing trends in earnings and the forces that might affect each sector in Q2 FY27.
Pharmaceutical Sector in India: Strong Five-Year Performance
The Nifty Pharma index recorded a 13.64% five-year CAGR through 30 September 2026, the highest among the four sectors considered in this comparison.
The pharmaceutical sector in India has several earnings drivers. Domestic formulations provide exposure to the Indian healthcare market, while exporters can be influenced by US demand, product launches, pricing, and regulatory developments. Currency movements and input costs can also affect margins.
Investors in pharma companies can thus move beyond historical returns for Q2 FY27. More up-to-date information is available in revenue growth, EBITDA margins, domestic sales, export performance, product launches, regulatory developments, and management guidance.
Track Pharma Sector in India Updates Get the latest pharma earnings, company news and sector trends on Lumic.
Banking Industry in India: Credit Growth Remains Important
The Nifty Bank index recorded an 8.72% five-year CAGR as of 30 September 2026.
The banking industry in India is closely linked to economic activity because loan growth, deposits, interest rates, and credit quality influence bank earnings. However, a strong headline growth number does not necessarily translate into stronger profitability if asset quality or funding costs deteriorate.
When analysing banks, investors can track:
- Loan and deposit growth
- Net interest margin
- Asset quality
- Gross and net NPAs
- Credit costs
- Provisioning
- Return on assets and equity
For Q2 FY27, these operating indicators may offer a more current picture than five-year market returns alone.
Track Banking Industry in India Updates Get the latest bank earnings, credit trends, and financial sector newson Lumic.
IT Industry in India: Five-Year Data Reflects a Challenging Period
The Nifty IT index recorded a -2.63% five-year CAGR through 30 September 2026.
However, this figure should not be interpreted as meaning that the IT industry in India has remained weak throughout the entire period. The sector has experienced significant changes in global technology spending, enterprise demand, currency movements, employee costs, and expectations surrounding artificial intelligence.
For the IT sector in India, investors may focus on:
- Constant-currency revenue growth
- EBIT margins
- Utilisation
- Deal wins and order bookings
- Attrition
- Employee costs
- Management guidance
- AI-related demand
Q2 FY27 results can provide fresh evidence about whether global technology spending is translating into stronger revenue and profitability for Indian IT companies.
Stay Ahead With IT Sector in India News Catch the latest IT earnings, business updates and sector trends on Lumic.
FMCG Industry in India: Steady Demand, Moderate Returns
The Nifty FMCG index recorded a 3.65% five-year CAGR through 30 September 2026.
The FMCG industry in India is influenced by household consumption, volume growth, pricing, rural demand, urban spending, and input costs. Compared with more cyclical sectors, FMCG companies generally operate around recurring consumer demand, but their margins can still fluctuate when commodity prices or advertising expenses change.
For the FMCG sector in India, Q2 FY27 results could provide clues about whether consumption trends are strengthening.
Investors can monitor:
- Volume growth
- Rural and urban demand
- Pricing growth
- Gross margins
- EBITDA margins
- Input costs
- Advertising expenditure
- Management commentary
Auto Sector in India: Cyclical Growth and Demand Trends
The auto sector in India is influenced by consumer demand, interest rates, fuel prices, commodity costs, and broader economic activity. Passenger vehicles, two-wheelers, commercial vehicles and tractors can experience different demand cycles, making segment-level analysis important when assessing the sector.
For Q2 FY27, investors may focus on vehicle volumes, new model launches, rural demand, financing conditions, input costs and operating margins. Electric vehicle adoption and changing consumer preferences may also influence the competitive landscape.
Rather than relying only on historical stock-market returns, investors can compare quarterly sales growth, margins and management guidance to assess whether current operating trends support the sector's outlook.
How Do the Four Sectors Compare Over Five Years?
The latest NSE data provides a straightforward historical snapshot:
| Sector | Five-Year CAGR |
|---|---|
| Nifty Pharma | 13.64% |
| Nifty Bank | 8.72% |
| Nifty FMCG | 3.65% |
| Nifty IT | -2.63% |
Data as of 30 September 2026; five-year figures are CAGR based on total-return index values.
The figures indicate that pharma and banking have been providing positive compounded returns throughout the term, whereas FMCG experienced more decent returns and IT was negative over five years.
However, this historical comparison cannot be considered a forecast of Q2 FY27. A sector that has been a winner in the last five years may have current earnings strains, and a poor-performing sector in the past may have rising earnings or valuation.
What Could Shape Sector Performance in Q2 FY27?
The Q2 FY27 earnings period may give various signs in each sector.
- In the case of pharma, investors can look at domestic demand, exports, government trends, and product-level performance.
- In the case of banking, the increase in loans, deposits, net interest margins, and quality of assets may determine the earnings.
- In the case of IT, global technology expenditure, AI demand, deal gains, utilisation and margins might continue to hold significance.
- In the case of FMCG, volume expansion, consumption in rural areas, the prices and input-cost changes may indicate whether growth in revenues will be converted into an increase in profitability.
Should Historical Returns Decide Which Sector to Watch?
Past performance can be important in providing context, but it cannot be made in isolation and used to determine which sector has a more favorable performance in Q2 FY27.
Three factors could be combined into a more complete evaluation of long-term performance, recent earnings momentum, and industry-specific catalysts.
The latter is especially significant since not only the improvement of earnings is used to evaluate the performance of markets, but this also relates to what investors were already anticipating and how the valuations relate to historical rates.
Stay Updated on Q2 FY27 Sector News
Five-year data can show where sectors have been, but quarterly results reveal what is changing now. To stay updated on Q2 FY27 results, sector developments, and financial news updates that drive the stock market, you can download the Lumic app and follow the latest developments in one place.
Disclaimer: This article is for educational purposes only and does not constitute investment advice. Equity investments are subject to market risks. Please consult a SEBI registered investment adviser before making investment decisions.