Markets
What Is EBITDA? How to Read EBITDA in Q2 Results
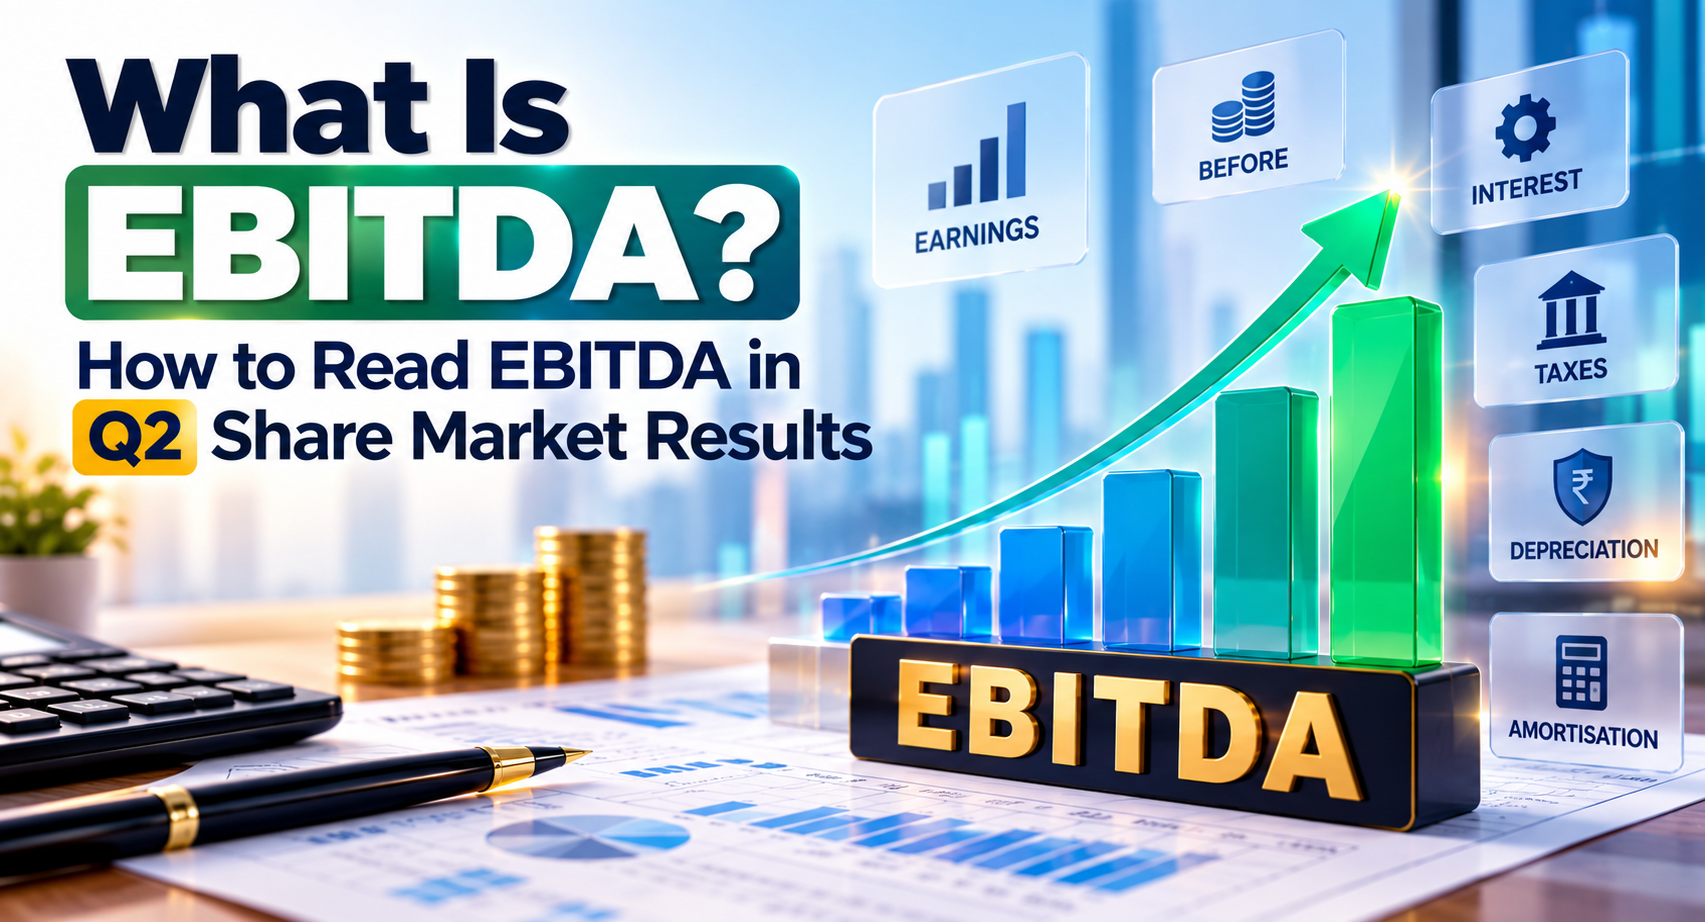
As Indian companies report their Q2 FY27 results, investors are paying close attention to EBITDA. EBITDA, or Earnings Before Interest, Taxes, Depreciation and Amortisation, is a measure of operating profitability.
In a company's P&L statement, it can broadly be understood by adding back interest, tax, depreciation and amortisation to profit after tax (PAT), subject to adjustments for other non-operating or exceptional items. In simple terms, EBITDA shows the profit generated by the core business before financing costs, taxes, and non-cash depreciation and amortisation expenses are considered.
So, what is EBITDA, and how should investors read it in quarterly results? Let's break it down.
What Is EBITDA?
EBITDA stands for Earnings Before Interest, Taxes, Depreciation and Amortisation. It focuses on the profitability generated by a company's core operations before financing costs, taxes and depreciation-related expenses.
For investors reading a quarterly P&L, EBITDA is useful because it helps separate operating performance from the impact of how a company is financed, taxed or depreciated.
For example, a highly leveraged company may have strong operating performance but lower PAT because of substantial interest costs. Similarly, a business with significant fixed assets may report higher depreciation, reducing PAT even when its underlying operations remain strong.
A simple way to understand the relationship is:
- EBITDA → operating strength of the business
- PAT → profit ultimately remaining after major expenses
How Is EBITDA Calculated?
EBITDA = PAT + Interest + Tax + Depreciation + Amortisation
For example, if a company reports ₹100 crore in PAT, ₹20 crore in interest, ₹30 crore in tax, and ₹50 crore in depreciation and amortisation, its EBITDA would be ₹200 crore.
EBITDA Margin = (EBITDA ÷ Revenue) × 100
So, if the same company generates ₹1,000 crore in revenue, its EBITDA margin would be 20%.
The calculation provides a simplified way to understand the relationship between EBITDA and PAT. Actual financial statements may require adjustments for exceptional and non-operating items.
This is the most strategic addition because it answers both "what is EBITDA?" and "how do I find it in a P&L?" immediately.
What is the Significance of EBITDA in Quarterly Results?
EBITDA gives investors a clearer view of a company's operating performance.
Suppose revenue increases by 10% and EBITDA increases by 15%. The company is growing its operating profit faster than its sales. This could indicate better cost control or operating leverage.
Now consider the opposite situation. Revenue rises by 10%, but EBITDA increases by only 3%. This may indicate that operating costs are growing faster than sales.
A falling EBITDA margin can provide another warning sign. It may suggest that the company is finding it harder to convert sales into operating earnings.
There is another situation investors should watch for: EBITDA can rise while PAT falls. This can happen when interest expenses, depreciation, taxes, or exceptional items increase significantly. In such cases, the company may be improving its core operating performance while still reporting weaker bottom-line profit.
That is why EBITDA is useful when reading quarterly results, but it should never be viewed in isolation.
What Makes EBITDA Different From PAT?
PAT is the profit that remains after interest, depreciation, taxes, and other applicable expenses have been accounted for. Therefore, a company can report strong EBITDA but much lower PAT if it has high debt and interest costs, significant depreciation or a large tax expense. EBITDA helps assess the strength of the core business, while PAT shows how much profit ultimately remains.
ICRA expects India Inc's revenue growth to moderate to around 13–15% in Q2 FY27. It also expects operating profit margins to contract by 1–1.5 percentage points year-on-year, mainly because of higher input, fuel, freight and packaging costs. This makes EBITDA and EBITDA margin especially useful when assessing whether companies are growing profitably or simply increasing sales.
However, EBITDA does not tell the same story across every sector.
For example, Lupin reported a 75.8% year-on-year increase in EBITDA and a 35.6% EBITDA margin in Q2 FY26. This shows how changes in operating performance can have a significant impact on profitability.
In IT, investors may focus more on EBIT margins, utilisation, and constant-currency growth. Banking and FMCG companies require a different set of indicators.
How EBITDA Is Used Across Different Industries
EBITDA should always be interpreted alongside sector-specific indicators. The same margin can mean something different depending on the company's business model, cost structure, and growth stage.
EBITDA in the Pharma Industry
For pharmaceutical companies, EBITDA and EBITDA margin can help investors assess operating profitability as product mix, pricing, raw-material costs, exports, and R&D spending change.
When reading a pharma Q2 result, look at more than EBITDA growth. Check:
- EBITDA margin
- Domestic and export revenue
- Product mix
- Input costs
- R&D expenditure
- Management commentary
A stronger EBITDA margin could indicate better product mix or cost control. On the other hand, margin pressure may come from higher input costs, pricing changes or increased spending.
EBITDA in the Automobile Industry
For automobile companies, EBITDA and EBITDA margin help investors assess how effectively sales are translating into operating profit amid changes in vehicle volumes, pricing and input costs.
When reading an auto Q2 result, look at:
- Vehicle volumes
- Realisation and pricing
- Commodity costs
- Product mix
- Export performance
- EBITDA margin
A rise in EBITDA despite stable revenue could indicate better cost control, pricing or product mix. Conversely, margin pressure may reflect higher commodity costs, discounts or weaker operating leverage.
EBITDA in the IT Industry
EBITDA can help evaluate operating profitability in IT, but it is not the only metric investors should track.
IT investors often focus on:
- EBIT margin
- Constant-currency revenue growth
- Utilisation
- Deal wins
- Employee costs
- Management guidance
For example, revenue may grow while margins decline because of higher employee costs, subcontracting expenses, or lower utilisation. This is why EBITDA should be read alongside the broader operating picture.
Get IT Sector in India News on Lumic Stay updated with the latest IT earnings across the IT stocks news in India. Download the Lumic App
EBITDA in the Telecom Industry
Telecom is another sector where EBITDA can be particularly useful.
Investors can compare EBITDA growth and margin with metrics such as average revenue per user (ARPU), subscriber additions, churn, and operating leverage.
For example, higher ARPU can increase revenue if operating costs do not rise at the same pace.
However, telecom companies often require significant capital expenditure and may carry substantial debt. As a result, investors should read Q2 telecom results alongside EBITDA, ARPU, subscriber numbers, capex, and leverage.
Lumic’s telecom and sector coverage can help investors follow relevant developments during the earnings season.
EBITDA in the Real Estate Industry
Real estate shows why EBITDA alone may not explain the complete earnings picture.
Revenue recognition can depend on project accounting and completion timelines. Investors should therefore look beyond reported EBITDA.
For a real estate Q2 result, consider:
- Bookings
- Collections
- Project launches
- Cash flow
- Net debt
- EBITDA and EBITDA margin
These indicators can provide a better understanding of the company's underlying operating performance.
EBITDA Is Not the Same for Every Industry
There is no universal way to interpret EBITDA.
- For pharma companies, investors should consider domestic and export sales, product mix and R&D.
- For auto companies, volumes, pricing and commodity costs can be more important.
- For IT companies, EBIT margin, constant-currency growth, utilisation and deal wins provide additional context.
- For telecom companies, ARPU, subscribers, capex and leverage matter.
- For real estate companies, bookings, collections, project launches, cash flow and debt can be critical.
This also explains why there is no universal answer to what is a good EBITDA or what makes a good EBITDA margin.
Instead, compare a company's current EBITDA and margin with its own historical performance, industry peers, and the broader business environment.
How to Read EBITDA in Q2 Results
Reading EBITDA in a Q2 result is not simply about checking whether the number has increased or decreased. The objective is to understand what drove the change and whether the improvement in operating performance is sustainable.
Start With Revenue and EBITDA Growth
First, compare revenue growth with EBITDA growth. Look at both year-on-year and, where relevant, sequential performance.
If EBITDA grows faster than revenue, the company may be benefiting from better operating leverage or cost efficiency.
For example, if revenue rises 10% but EBITDA increases 20%, operating profitability is improving at a faster rate than sales.
On the other hand, if revenue rises 10% but EBITDA grows only 4%, rising operating costs may be putting pressure on profitability.
Check the EBITDA Margin
Next, look at the EBITDA margin. An increase in margin usually indicates that the firm is making more operating income per rupee of turnover, whereas a dwindling margin may be a sign of cost pressure.
The next question is why the margin changed. Look for factors such as:
- Changes in product mix or pricing
- Sales volumes and capacity utilisation
- Raw-material and commodity costs
- Employee or other operating expenses
- Operating leverage
- Foreign-exchange movements, where relevant
- Management commentary and guidance
Compare EBITDA With PAT
Finally, move below EBITDA and examine PAT. Check depreciation, finance costs, taxes and exceptional items.
A company can report higher EBITDA but lower PAT if interest costs, depreciation or taxes rise sharply.
For example, stronger operating performance may increase EBITDA, but higher borrowing costs can reduce the amount that ultimately reaches net profit.
Looking at revenue, EBITDA, EBITDA margin and PAT together gives investors a more complete view of the quarterly results.
Stay Updated on Quarterly Results
Q2 earnings can provide important information about revenue growth, margins, costs and management outlook.
But the earnings story continues to change as more companies report their results.
Investors following the quarterly results of companies can use each new announcement to compare performance across businesses and sectors.
To stay updated on quarterly results and financial news that can influence the stock market, download the Lumic app and follow company earnings, sector developments and market-moving updates in one place.
Whether you are following a pharma Q2 result, IT Q2 result, auto earnings or telecom performance, tracking the latest developments can help you understand how companies are performing throughout the earnings season.
Disclaimer: This article is for educational purposes only and does not constitute investment advice. Equity investments are subject to market risks. Please consult a SEBI registered investment adviser before making investment decisions.