Markets
IT Sector Q2 FY27 Preview: TCS, Infosys & Wipro Results
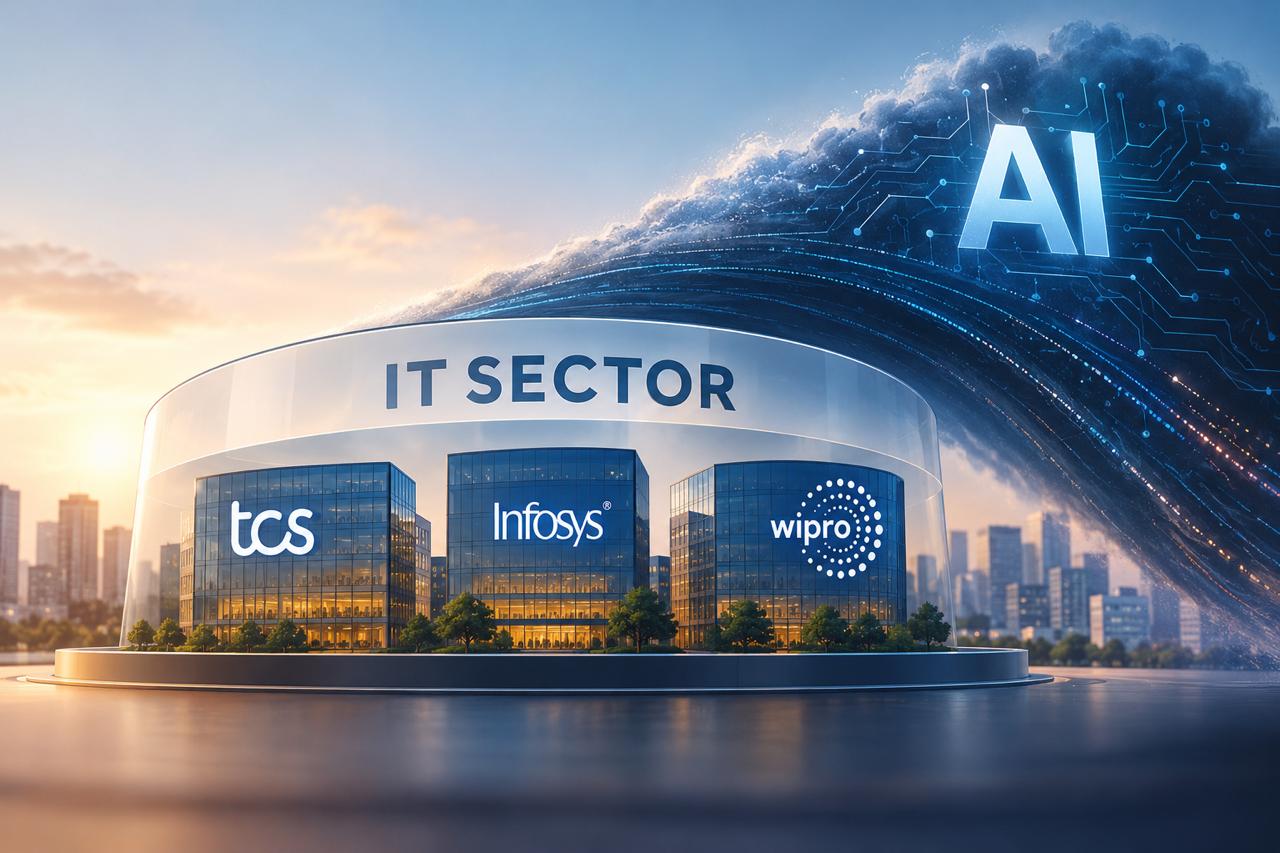
Q1 FY27 results suggest that the IT sector is still operating in a cautious demand environment, but there are clear pockets of strength.
AI-led transformation is becoming increasingly important for large technology companies.
TCS reported annualised AI revenue of $2.6 billion in Q1, up 13.6% sequentially, while its total contract value stood at $9.5 billion. Infosys reported $3.6 billion in large-deal TCV, with 61% of the wins being net new. Wipro reported $1.6 billion in large-deal bookings, up 12.9% sequentially in constant currency.
However, strong deal activity has not translated into equally strong near-term revenue growth across all three companies. This makes Q2 earnings particularly important for determining whether the current pipeline is converting into actual revenue.
Infosys Q1 Results: Growth, AI and Margins Remain
Key
The Infosys Q1 results showed revenue of ₹48,211 crore, up 14% year-on-year in rupee terms. Operating profit increased 15.4% to ₹10,163 crore, while operating margin stood at 21.1%. Net profit increased 12.2% to ₹7,769 crore.
In constant-currency terms, Infosys revenue grew 2.4% year-on-year and 1% sequentially.
The company also reported $3.6 billion in large-deal wins, with 61% classified as net new.
AI is another important part of the Infosys results story. AI revenues accounted for 8.2% of total revenue in Q1, highlighting the growing contribution of AI-led services to the business.
Infosys also revised its FY27 revenue growth guidance to 1.5%-3.0%, while retaining its operating-margin guidance of 20%-22%.
What to Watch in Infosys Q2 Results
For Infosys Q2 earnings , investors should focus on whether revenue growth accelerates from Q1 levels and whether margins remain within the company's guided range.
Large-deal conversion will also be important. Strong bookings can support future revenue, but the timing of revenue recognition matters when assessing quarterly performance.
Investors following Infosys results should also watch AI revenue, the contribution of large deals, client spending trends, and management commentary around discretionary technology spending.
CTA:
Track the latest Infosys results and IT sector updates in one place.
Download the Lumic app
TCS Q1 Results: Strong Margins and AI Momentum
The TCS Q1 results showed revenue of $7.624 billion, flat sequentially and up 2.7% year-on-year in US dollars. Constant-currency revenue increased 0.4% sequentially.
Operating margin stood at 24%, while net margin was 19.2%.
TCS also reported $9.5 billion in total contract value during the quarter. Annualised AI revenue reached $2.6 billion, showing the growing contribution of AI-related business.
The company's Q1 performance highlighted demand across areas such as AI transformation, cybersecurity, sovereign cloud and platform modernisation. The combination of a strong margin profile and rising AI revenue gives investors two important metrics to track alongside headline growth.
What to Watch in TCS Q2 Earnings
The TCS Q2 earnings will provide clues about whether the company's strong order book is converting into broader revenue growth.
Investors can track:
- Revenue growth in constant currency
- Total contract value
- AI-related revenue
- Operating margin
- Growth across major geographies and industries
- Client spending on transformation projects
- Management commentary on pricing and demand
A key factor will be whether AI-led demand can offset weakness in more discretionary technology spending.
Wipro Q1 Results: Large Deals Offer Support
The Wipro Q1 results were comparatively softer on revenue growth. IT services revenue was $2.6145 billion, down 1.4% sequentially but up 1% year-on-year. Constant-currency IT services revenue increased 0.9% year-on-year.
Wipro's large-deal bookings increased 12.9% sequentially to $1.626 billion in constant currency. This provides a positive indicator for the future revenue pipeline.
The main concern was profitability. IT services operating margin fell to 16% from 17.3% in Q4 FY26. Wipro attributed some near-term margin volatility to investments in people and strategic priority areas.
What to Watch in Wipro Q2 Quarterly Results
The Wipro quarterly results will be important for assessing whether revenue momentum and margins are beginning to stabilise.
Wipro has guided for Q2 IT services revenue of 2. 574𝑏𝑖𝑙𝑙𝑖𝑜𝑛 − 2.627 billion, equivalent to sequential constant-currency growth of -1.5% to +0.5%.
For Wipro Q2 earnings , investors will also watch whether large deal bookings begin translating into revenue, whether margins recover from the Q1 level, and whether management sees an improvement in client spending.
TCS vs Infosys vs Wipro: What Q1 Results Indicate
The three companies entered Q2 with different strengths:
- TCS: 2.7% year-on-year revenue growth in US dollars, 24% operating margin, $9.5
billion TCV and $2.6 billion in annualised AI revenue.
- Infosys: 2.4% year-on-year constant-currency growth, 21.1% operating margin, $3.6
billion in large-deal TCV and 61% net-new deal contribution.
- Wipro: 0.9% year-on-year constant-currency growth, 16% operating margin and
$1.63 billion in large-deal bookings.
The comparison shows why investors should not assess the IT sector only through revenue growth. Margins, deal wins, AI revenue, geographical demand, guidance and deal conversion can provide additional clues about the direction of earnings.
For example, TCS currently has the strongest operating-margin profile among the three, while Infosys combines relatively healthy margins with significant large-deal activity. Wipro's Q2 performance needs to provide clearer evidence of revenue and margin recovery.
What Could Drive IT Sector Growth in Q2 FY27?
AI is likely to remain one of the biggest themes during the Q2 earnings season. Enterprises are increasingly looking beyond experimentation towards AI implementation, automation and transformation.
For IT services companies, this can create opportunities in cloud migration, data modernisation, cybersecurity, software engineering and AI-enabled business processes.
However, investors should also consider the timing of spending. Large deal wins may not immediately translate into quarterly revenue, while weaker discretionary spending can continue to affect short-term growth.
Currency movements, employee costs, utilisation, subcontracting expenses and pricing pressure can also influence margins. These factors become particularly important when revenue growth remains modest.
Key Metrics to Track in IT Q2 Results
When analysing the upcoming Infosys Q2 results , TCS Q2 results and Wipro Q2 earnings , investors can focus on five broad areas.
- Revenue growth: Look at both year-on-year and sequential constant-currency
growth.
- Deal wins: Large deal TCV and bookings can provide an indication of future revenue
visibility.
- Operating margins: Compare margins with the previous quarter and year-ago
period to understand cost pressures and operating leverage.
- AI contribution: AI-related revenue, bookings and transformation deals can indicate
whether companies are successfully monetising AI demand.
- Management guidance: Commentary on client budgets, discretionary spending,
hiring, utilisation and demand can help put quarterly numbers into context.
CTA Banner
Heading: Following TCS, Infosys and Wipro results?
Track simplified financial news, earnings updates and important market developments in one place.
Download the Lumic app
IT Sector Q2 FY27 Outlook
The Q1 results suggest that India's leading IT companies are entering Q2 with strong deal pipelines but uneven revenue momentum.
TCS has demonstrated strong profitability and growing AI revenue; Infosys has combined healthy margins with significant large-deal wins and revised FY27 revenue guidance, while Wipro needs to demonstrate better revenue momentum and margin stability.
Therefore, the IT sector Q2 FY27 outlook will depend less on headline deal announcements alone and more on how quickly those deals convert into revenue and whether companies can maintain profitability while investing in AI capabilities.
The upcoming quarterly results can provide a clearer indication of whether the current AI and transformation spending cycle is beginning to translate into sustained revenue growth.